Using Transport Insights’ Data Quality functionality, Road Controlling Authorities (RCAs) can view their annual static reports and learn more about the quality of their roading data, where it is excellent and where it can be improved.
Transport Insights(external link)
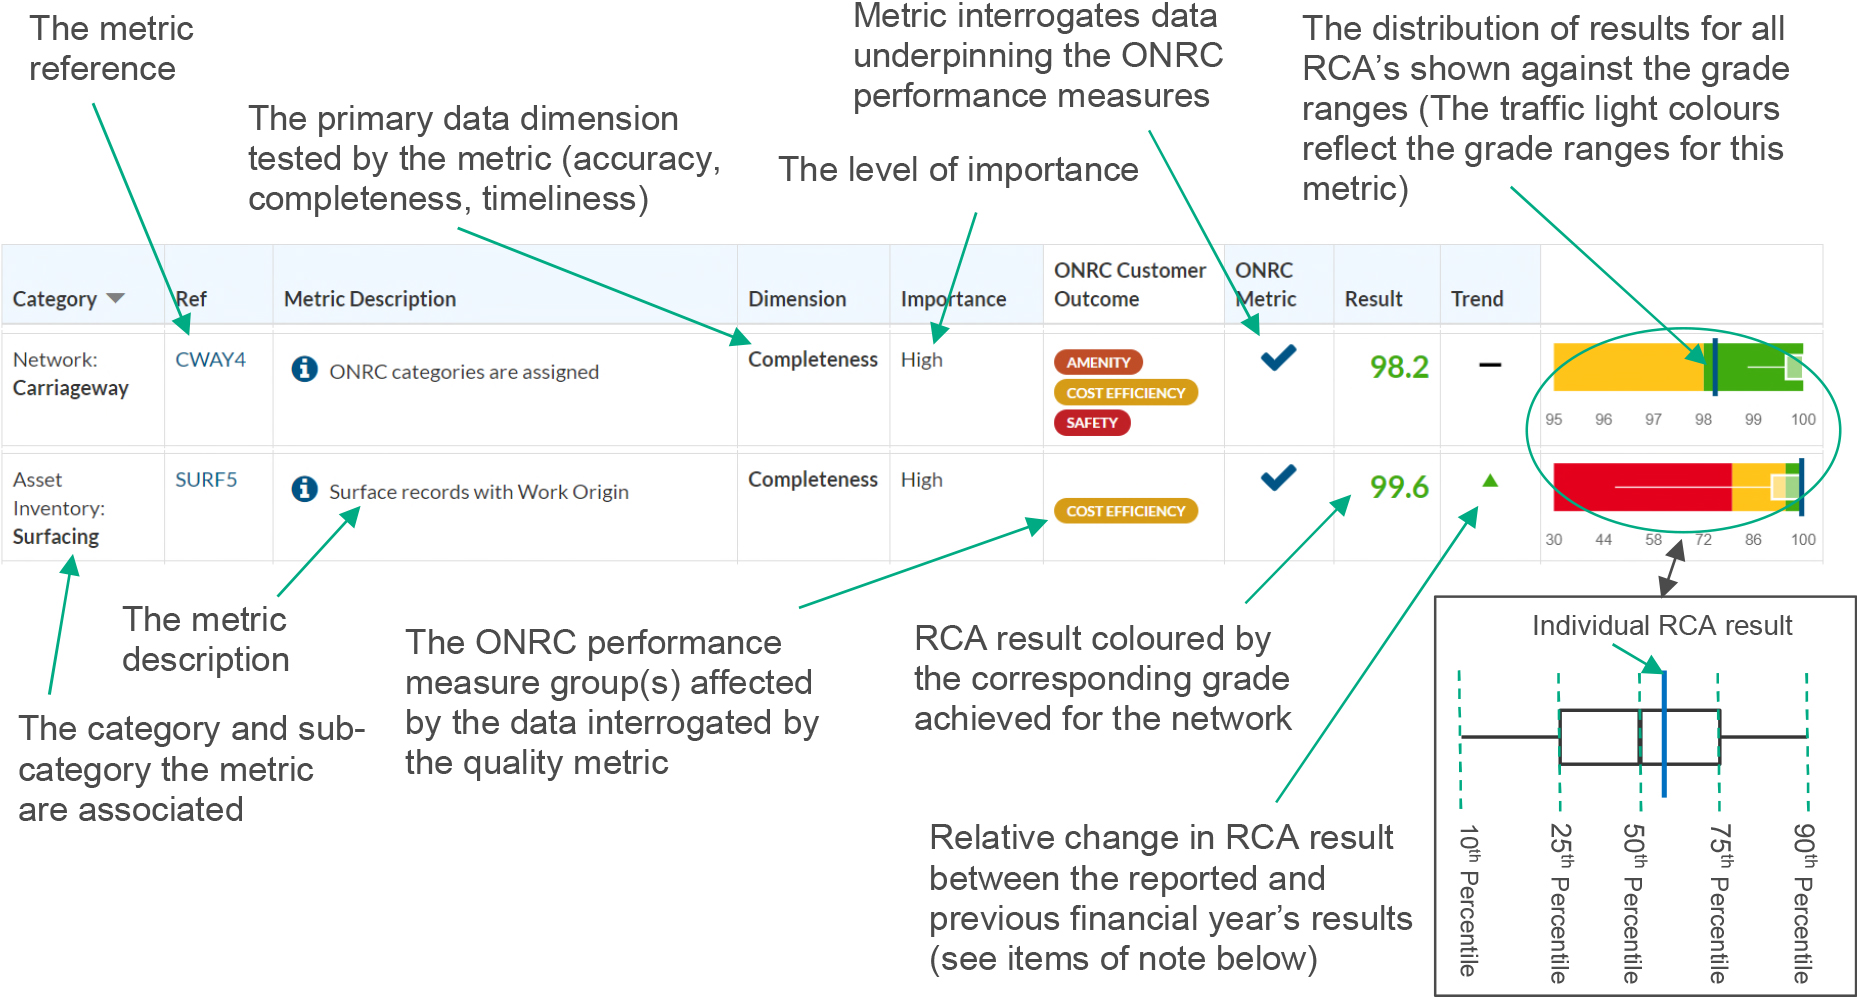
The annual asset management data quality results and static reports are within Transport Insights. In addition, there is functionality so that RCAs can interrogate their annual data quality results through a dashboard and access data quality metric information such as the RAMM SQL scripts to help to identify the root cause and records to improve.
The annual generation of the data quality results, and static RCA reports are produced by Transport Insights for 2018/19 onwards for TLAs (including DoC) and 2019/20 onwards for Waka Kotahi state highway regions. An annual summary of the RCA results, which includes a tool to compare each RCAs data quality performance against the national performance is available on the Te Ringa Maimoa website. Annual reports of a RCA’s data quality, including the individual metric results, are only available within Transport Insights.
Annual summaries of the RCA results
Transport Insights data quality functionality overview [PDF, 5.4 MB]
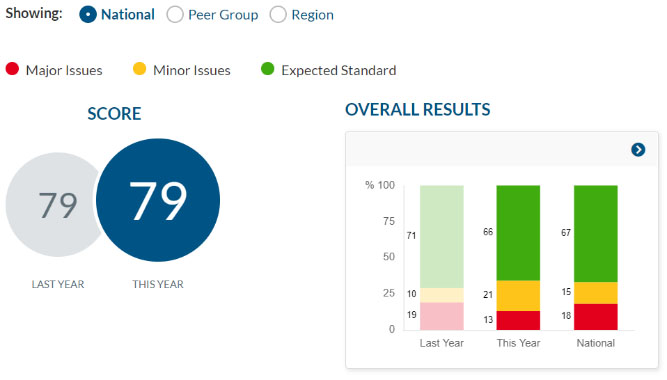
The Data Quality Dashboard shows ‘Last year’ overall score and grades as well as ‘This year’. Both sets of results showing in the dashboard use the latest annual metric calculations. TLAs (including DoC) can choose to compare their dashboard summaries against the national figures, their region figures, or their peer group figures.
Data quality metrics results can be recalculated whenever a RCA imports their data from RAMM part-way through the year. This means a RCA can easily check its progress in the data quality metrics and identify remaining areas to improve. As some results cannot be calculated part-way through the year, some metrics will not show results.
Information about each metric, including annual metric changes history (if any), is contained in the online metric library or within Transport Insights. The metric library also includes the RAMM SQL and Exception SQL to find the records that may have issues. These should be used to uncover gaps in processes and information, not only to fix the symptom.
Data quality metric library(external link)
The overview Understanding the data quality results provides a more detailed level of support and direction to help understand the data results and read the annual data quality reports. The below figure provides an overview on how to read the results for each individual metric.
Understanding the data quality results [PDF, 564 KB]