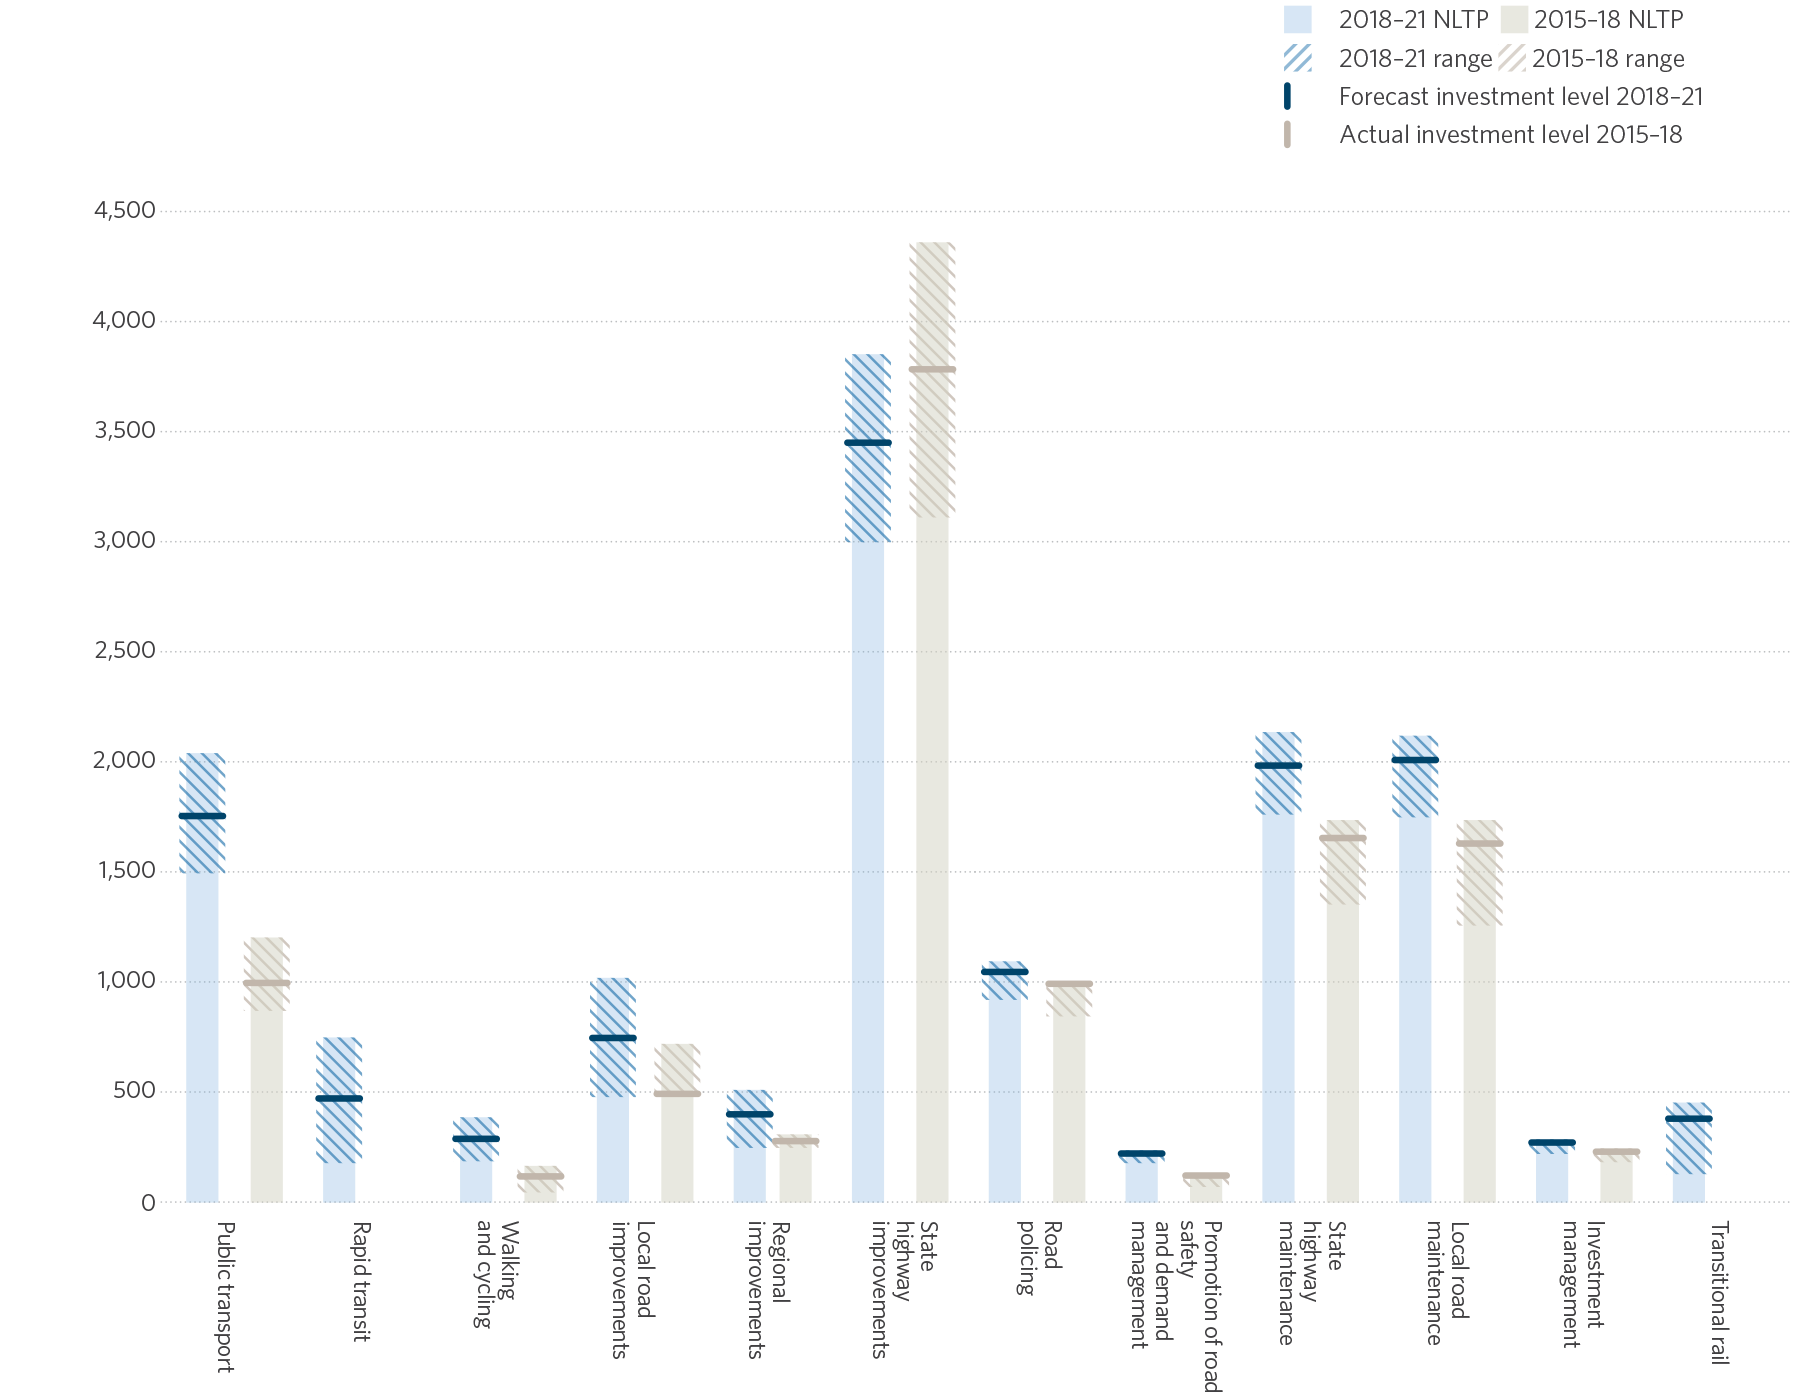
The proposed investment levels for each activity class are shown by the solid line on the graph below. Each of these is within the GPS funding range which is shown by the shading area. For comparison, the graph also illustrates the funding ranges and actual spend for the 2015–18 NLTP.